
How to drive more smoothly and use less fuel
A guide to habits for driving more smoothly and using less fuel, read from the signals the car shows on the dashboard. For each habit, what the studies measured and how to check it on your own car.

- Published
Driving smoothly is, above all, a way of reading the car. The rev counter (tachometer) needle, the consumption on the trip computer and the way the car keeps rolling when you lift your foot off the accelerator tell you, on every stretch, how much effort you are asking of the engine.
This guide goes through these signals in the order you notice them at the wheel: what appears, what it usually means, what to do now and what can wait. The numbers come from studies, with the source and year. They show what was measured in certain conditions, not what will happen in your car.
What smoothness changes in fuel use
Fuel goes to a few things: gaining pace, pushing the air aside, keeping the tyres rolling and keeping the engine turning, even when the car is standing still. Every hard acceleration followed by braking wastes energy that came from the fuel: it turns into heat in the brakes instead of carrying the car forward.
How much does this weigh? A 2016 technical review by Zacharof, Fontaras and colleagues brought together the literature on the subject. At the median of ten sources, an abrupt style, with hard acceleration and braking, used 26% more fuel; the economical style, at the median of six sources, used 6.5% less. A 2010 report by the IEA, the International Energy Agency, estimates that these habits together could cut the fuel used by some drivers by up to 20%, and possibly by 5% to 10% on average across all drivers, on a lasting basis. An article by Barkenbus (2010) reaches a similar order of magnitude: about 10%, on average and over time.
The weight changes with the type of road, as the measurements by Lenaers (2009) with a single petrol (gasoline) car show, tabulated in the 2016 review.
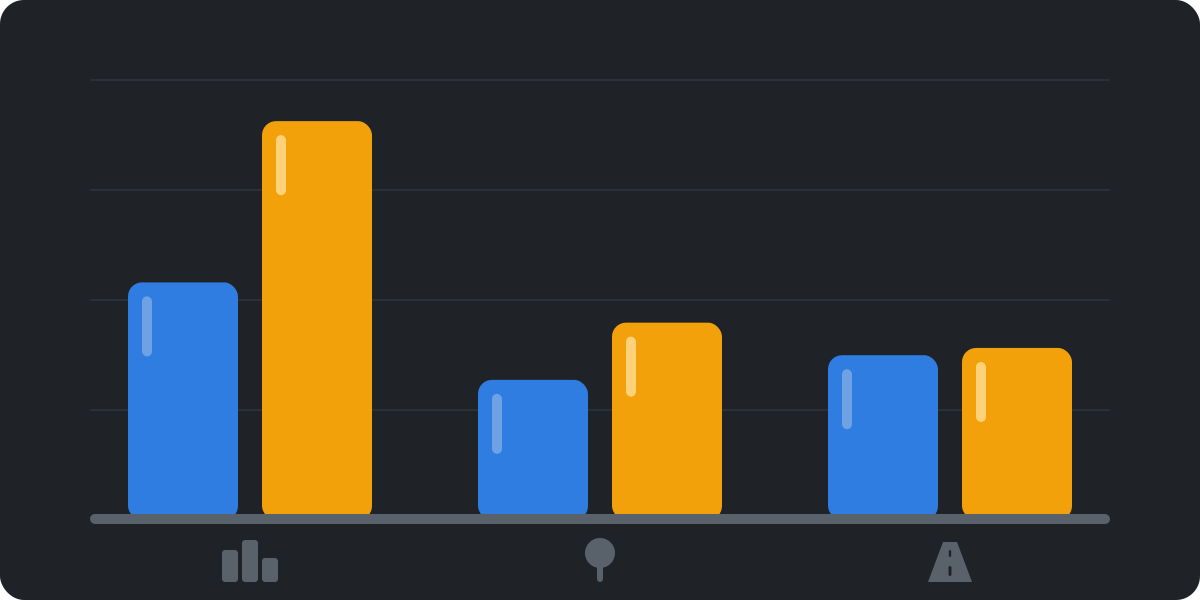
| Road type | Normal style | Abrupt style | Difference |
|---|---|---|---|
| Urban | 10.8 L/100 km (9.3 km/L) | 18.13 L/100 km (5.5 km/L) | +67.9% |
| Rural | 6.37 L/100 km (15.7 km/L) | 8.97 L/100 km (11.1 km/L) | +40.8% |
| Motorway (highway) | 7.49 L/100 km (13.4 km/L) | 7.82 L/100 km (12.8 km/L) | +4.4% |
The km/L values are rounded conversions.
The signals the car shows
Almost every current car shows on its dashboard how it is being driven, with four main signals.
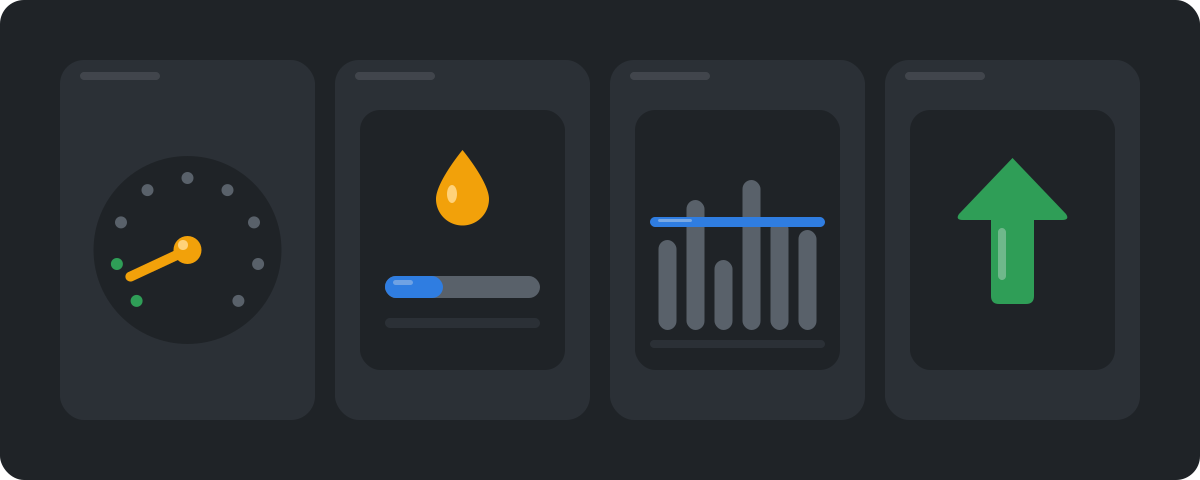
- Rev counter. A low, steady needle shows an engine working with room to spare. A needle that climbs high every time you pull away usually means a heavy foot or a low gear held for too long.
- Instant consumption. It reacts to every movement of your foot. In many cars, it drops to zero or close to it when you lift your foot with a gear engaged.
- Average consumption. It changes slowly and sums up the trip or the tank. It is for comparing days, not seconds.
- Gear-change arrow. In many manual cars, it suggests when to change up or down a gear. In automatics, the equivalent is usually a driving-style indicator or a driving mode.
These signals help. A 2018 study from the University of California, Davis brought together 17 studies on this dashboard feedback and found, on average, a 6.6% improvement in fuel use (from 4.9% to 8.3%): 3% in the studies on real roads and 10% in simulators, with a smaller effect in the longer interventions. A review by Huang and colleagues (2018) also notes that the effect of training and in-car devices fades over time. What counts, then, is turning the signal into a habit.
Light pedal and higher gears early
The first signal appears as you pull away. If the rev counter needle climbs high before each gear change, the engine is turning faster than the stretch calls for.
A 2018 IEA report describes economical driving with simple habits: moderate acceleration when the traffic light turns green, changing up early to the next gear in manual cars, and anticipating the traffic and the signals. In practice:
- Press progressively, without flooring the pedal, and let the car gain pace a little at a time.
- In a manual car, change up as soon as the engine accepts the next gear without shuddering, and use the highest gear the stretch allows. If there is a gear-change arrow, follow it.
- In an automatic car, a light foot plays the part of the early change: the gearbox (transmission) shifts up sooner when the pedal does not ask for power.
The moment of the change, on its own, makes little difference: the 2016 review records 1% to 2% with well-timed changes. The larger effect comes from the next habit. The revs for each change vary from engine to engine and are in your car’s manual.
Looking far ahead and letting the car roll
In town, where stops keep coming, this habit shows in the consumption at every block. A driver who looks only at the car in front reacts late: they accelerate until close to the traffic light and brake hard. A driver who looks several cars ahead sees the light turn red and has time to lift off earlier.
Lifting off early, with a gear engaged, uses almost no fuel. The 2016 review treats these phases as practically neutral in consumption, because the engine of most current cars cuts fuel injection at that moment. Your car’s manual says how it behaves, and the instant consumption shows it.
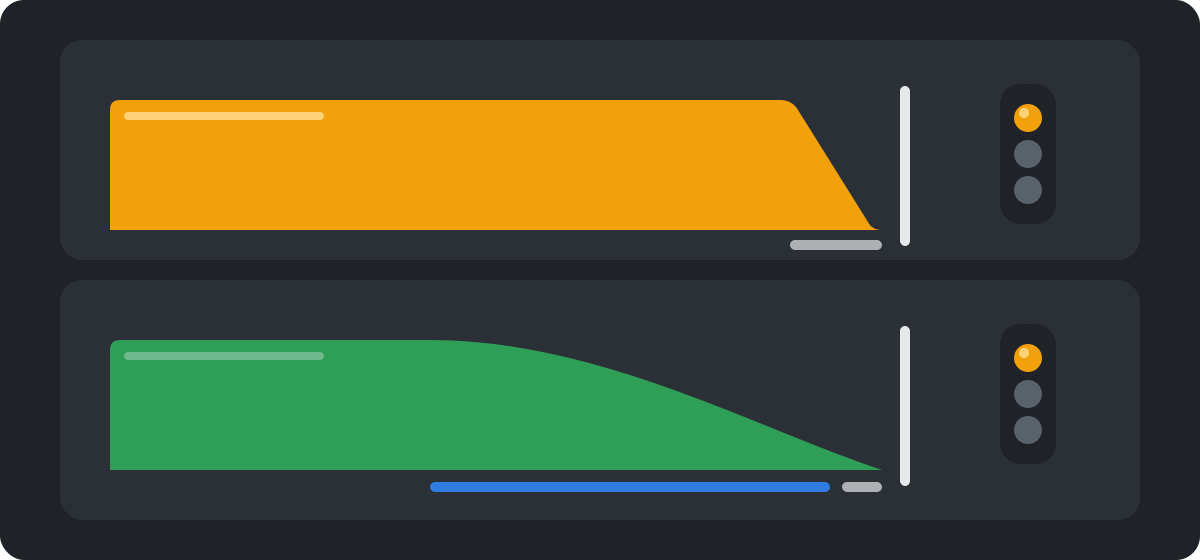
An example, on the approach to a red light:
- Look far ahead and notice the red light or the stopped queue up ahead.
- Lift your foot off the accelerator early, without changing gear, and let the car roll.
- Watch the instant consumption: in most cars, it drops to zero or close to it.
- Slow down a little at a time, braking lightly and only at the end.
- If the light turns green before you stop, carry on in the right gear, without coming to a complete stop.
A study by Thomas and colleagues, published in 2017 in the SAE International Journal of Fuels and Lubricants, measured 25% to 68% higher consumption with an abrupt style than with a gentle to normal style in slow-moving urban cycles, against 5% to 14% on the motorway. In hybrid and electric cars, part of the energy from slowing down goes back into the battery, and slowing down early counts in them too.
A steady pace and the air the car pushes
On the open road, the rev counter barely moves, and the instant consumption starts to follow the pace and how much it varies.
The air is the reason. The textbook University Physics, by OpenStax (2016), explains that the drag force grows with the square of how fast the object moves, and that, at motorway pace, more than half of a car’s power goes into overcoming air drag. An example: at double the pace, the drag becomes about four times greater.
For the open road, the 2018 IEA report includes keeping a uniform pace and using cruise control.
- Keep a steady, moderate pace, with the pedal held still instead of pressing and easing off all the time.
- On flat stretches, cruise control helps you keep that pace, if the car has it.
- On a climb, do not force the engine to hold the pace: press as you would on the flat and accept losing a little pace, which comes back on the way down.
Standing still, a cold engine and short trips
With the car standing still and the engine running, the average consumption rises without the car going anywhere: it is fuel without distance. During a long stop, switching off the engine avoids this use. Many cars with automatic stop-start do this on their own; the manual says under what conditions.
A cold engine also uses more. In the 2016 review, a cold start added about 10% to consumption in an 11 km (about 7 miles), 20-minute test at 23 °C (73 °F), and short trips came out 10% higher, at the median of three sources. Warming up the engine with the car standing still does not help, the same review concludes. The habit is to set off straight away and drive calmly while the engine warms up.
The route counts too: the same review reports an average difference of 10% between different routes linking the same points. A route with fewer stops and climbs may use less, even if it is longer; the average consumption over a few days shows which one suits your routine.
Tyres, load and roof
Three things away from the dashboard also show in the average consumption.
- Tyre pressure. The 2016 review reports 1.0% to 1.4% higher consumption with the tyres 0.2 bar (about 3 psi) below the value the maker gives. That value is in the manual and on the pressure label on the driver’s door pillar or on the fuel filler flap, often with one value for normal use and another for a full load.
- Load. The same review simulated 100 kg (about 220 lb) more and found a 2.6% to 2.8% rise in consumption; the 2018 IEA report cites 0.33% more consumption for every 1% more mass. Things forgotten in the boot (trunk) count too.
- Roof. The same report estimates that an empty roof rack, or a bicycle carrier at the back, raises consumption by at least 5% to 10% on average. If it is not in use, taking it off is the simplest habit on this list.
Air conditioning and windows
Air conditioning takes power from the engine. The 2016 review speaks of an increase of around 9% on average, with a median of 5% across ten sources, and its share is greater in town: a study cited in the review measured 4% on urban roads, 2.5% on rural roads and 1% on the motorway.
Open windows increase the air drag, which weighs more the higher the pace: the same review gathers a median of 4.8% more at motorway pace, across three sources.
Which of the two uses more? The review concludes that the existing data do not allow a clear answer. One possible reading of the numbers: in town, windows open when the weather allows; on the open road, windows closed and the air conditioning at a moderate temperature.
How to check on your own car
The trip computer is the most useful instrument here, as long as you compare the car with itself. First, a summary of what the studies cited measured:
| Factor | Measured effect | Source |
|---|---|---|
| Abrupt style | +26% (median) | Technical review, 2016 |
| Short trips with a cold engine | about +10% | Technical review, 2016 |
| Empty roof rack | at least +5% to +10% | IEA, 2018 |
| Air conditioning on | +5% to +9% | Technical review, 2016 |
| 100 kg more | +2.6% to +2.8% (simulation) | Technical review, 2016 |
| Tyres 0.2 bar low | +1.0% to +1.4% | Technical review, 2016 |
| Well-timed gear changes | −1% to −2% | Technical review, 2016 |
To measure it on your car:
- Reset the average consumption on the trip computer; the manual shows how, and whether it appears in L/100 km or in km/L.
- Drive a route you always repeat, with the same fuel and a similar load, for a few days or a whole tank.
- Note the average consumption and reset it again.
- Repeat the route with the habits in this guide and compare the two averages.
Do not compare it with the catalogue figure. A 2016 ICCT fact sheet, with data from about 1 million vehicles, showed that the everyday consumption of new cars in Europe was about 42% above the laboratory value in 2015, against about 9% in 2001. The catalogue figure is for comparing cars with one another; your route is another matter.
The dashboard talks all the time. Driving smoothly is reading those signals before you press the pedal.
Common questions
Does rolling downhill in neutral use less fuel?
In general, no. In neutral, the engine keeps turning at idle and uses fuel. With a gear engaged and your foot off the accelerator, most current cars cut fuel injection, as the 2016 technical review describes.
Open windows or air conditioning?
The data gathered by the 2016 review do not give a clear answer. Air conditioning weighs more in town, and open windows at motorway pace.
Is it worth warming up the engine with the car standing still?
No, according to the 2016 review. Set off straight away and drive calmly for the first few kilometres.
How do you convert L/100 km to km/L?
Work out 100 ÷ the value. An example: 8 L/100 km corresponds to 100 ÷ 8 = 12.5 km/L. The sum works both ways: 12.5 km/L is 100 ÷ 12.5 = 8 L/100 km.
Does ECO mode make a difference?
It depends on the car. The 2016 review found only qualitative descriptions of these modes, with no common measure. The manual says what the mode changes in your car, and the average consumption, measured as in the previous section, shows the effect.